Plerion model of the X-ray plateau in short gamma-ray bursts
A simple model to describe X-ray plateaux as observed following some short Gamma-Ray Bursts
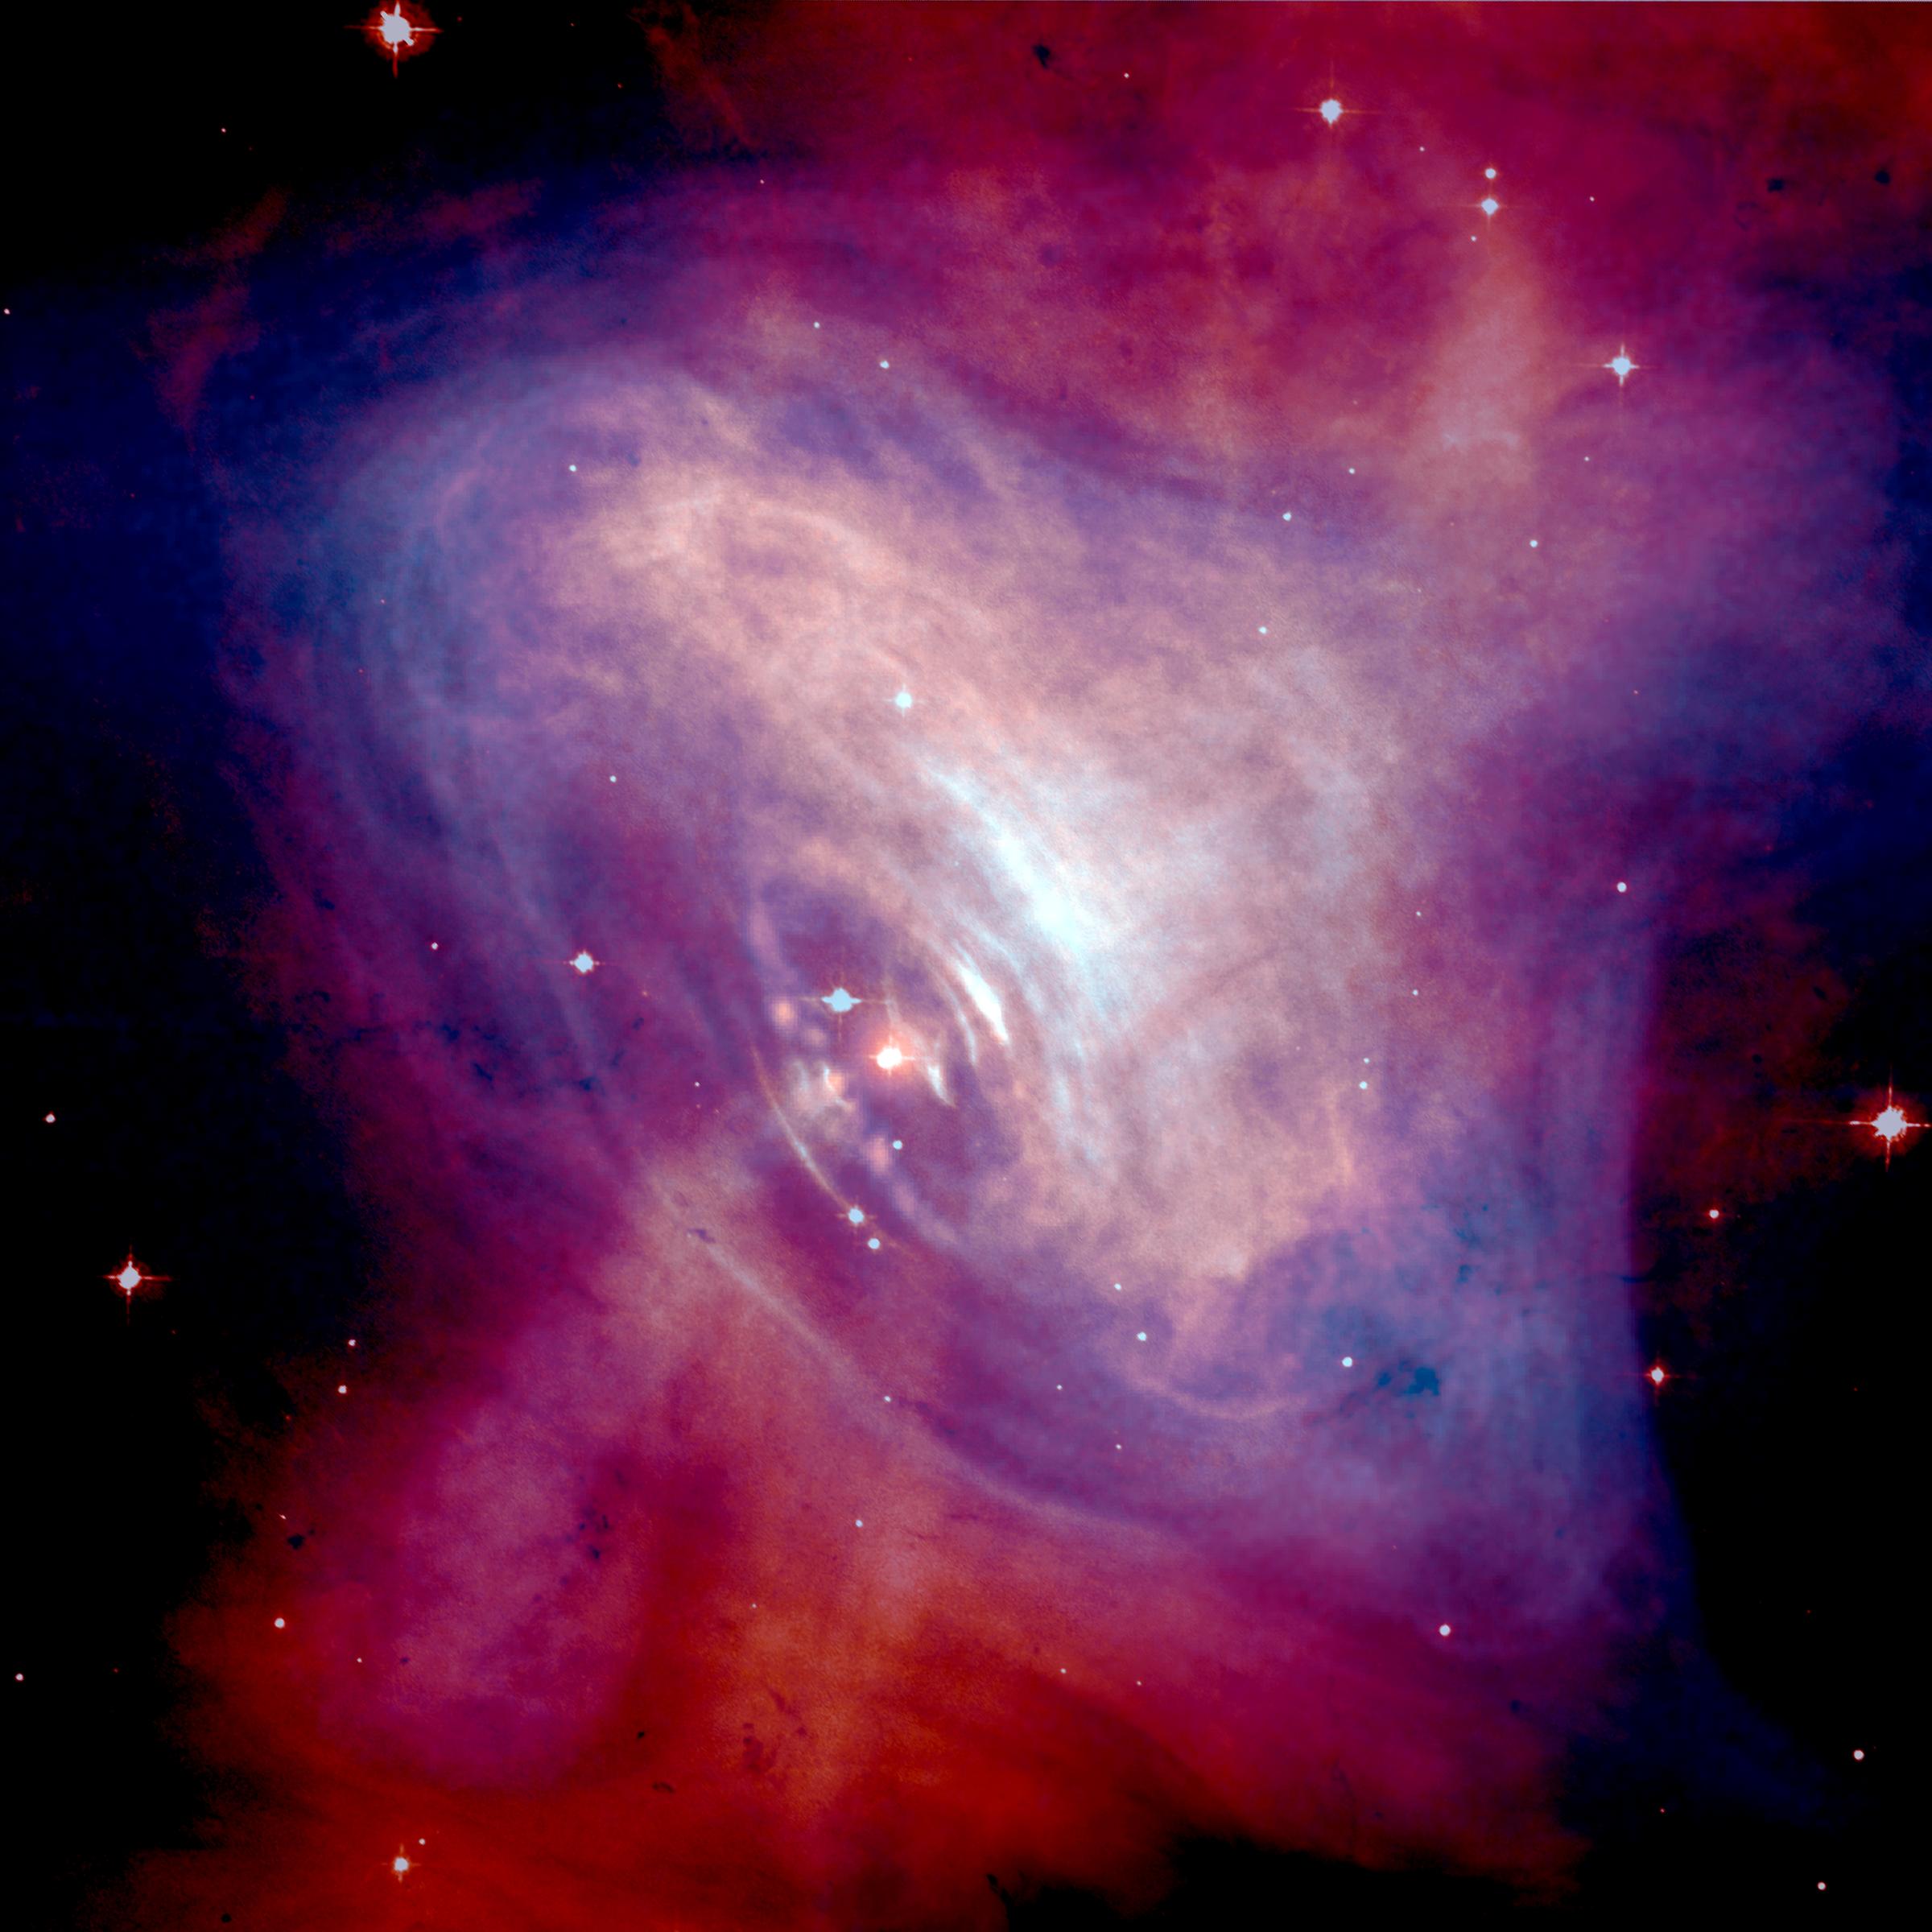
Central-engine models for sGRBs have a lot of similarities to early models of young supernova remnants (such as the Crab nebula, pictured). How much of our knowledge of supernova remnants can we leverage to explain observations of sGRBs and their afterglows?
Citation
Strang, L. C., and A. Melatos. “Plerion model of the X-ray plateau in short gamma-ray bursts.” Monthly Notices of the Royal Astronomical Society 487.4 (2019): 5010-5018. arxiv: 1906.02877
Abstract
Many short gamma-ray bursts (sGRBs) exhibit a prolonged plateau in the X-ray light curve following the main burst. It is shown that an X-ray plateau at the observed luminosity emerges naturally from a plerion-like model of the sGRB remnant, in which the magnetized, relativistic wind of a millisecond magnetar injects shock-accelerated electrons into a cavity confined by the sGRB blast wave. A geometry-dependent fraction of the plerionic radiation is also intercepted and reprocessed by the optically thick merger ejecta. The relative contributions of the plerion and ejecta to the composite X-ray light curve are estimated approximately with the aid of established ejecta models. The plerionic component of the electron energy spectrum is evolved under the action of time-dependent, power-law injection and adiabatic and synchrotron cooling in order to calculate the X-ray light curve analytically. The model yields an anti-correlation between the luminosity and duration of the plateau as well as a sudden cut-off in the X-ray flux, if the decelerating magnetar collapses to form a black hole. Both features are broadly consistent with the data and can be related to the surface magnetic field of the magnetar and its angular velocity at birth. The analogy with core-collapse supernova remnants is discussed briefly.
Overview
The observations
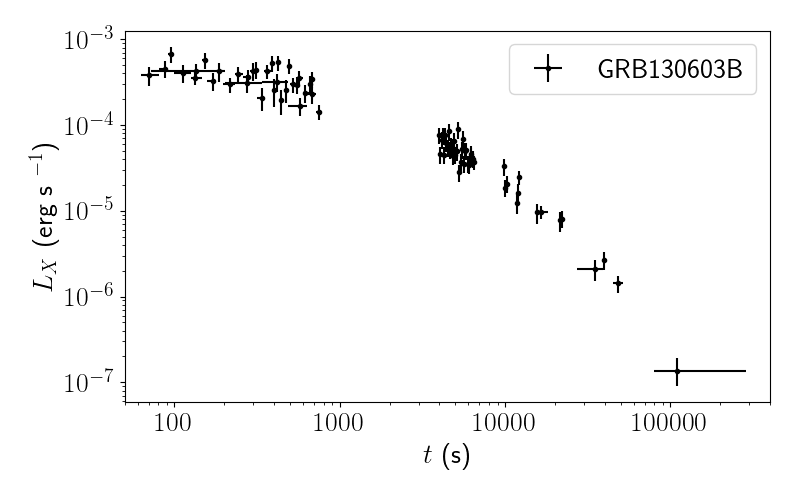
sGRBs are extremely bright, transient sources of light which last only a couple of seconds in the gamma-ray spectrum. Many sGRBs display an extended afterglow at longer wavelengths. In the case of X-rays, the afterglow sometimes takes the shape of a `plateau’ (Fig. 1). A typical X-ray plateau has three components: an initial decline, a plateau phase lasting from 10 s to \(10^5\) s, and a final decline. The last two phases are shown in Figure 1. for GRB130603B. The source of the plateau is widely debated in the community for several years, but no consensus has yet been reached.
The physics
One popular class of models proposes that the prolonged emission in the X-ray band is evidence of ongoing energy injection from a central engine. The most likely culprit is a millisecond magnetar: a highly magnetized, rapidly rotating neutron star. In this scenario, the rotational energy of the star is extracted via magnetic dipole braking and becomes the observed X-ray emission. At a high level, this is similar to early models of young pulsar wind nebulae, in particular the Crab nebula (Fig. 2.1). This work explores the possibility that the mechanism driving X-ray production following sGRBs may be similar to that driving X-ray production in pulsar wind nebulae.
What, then, is the physics? We assume that the merger leaves behind a rapidly rotating neutron star, which brakes electromagnetically as it emits a magnetized leptonic wind. As the pulsar spins down, its rotational energy is converted into a mixture of mechanical and electromagnetic energy flux. The interaction of the wind with the surrounding environment launches a reverse shock back into the wind, creating a ‘bubble’ of electrons just behind the shock. In the full paper, we explore the evolution of the electron distribution function N(E,t) under the effects of synchrotron radiation, adiabatic expansion, and the injection of new electrons as the reverse shock propagates into the wind. We solve the partial differential equation governing the system and use N(E,t) to infer the synchrotron luminosity and spectrum as a function of time.
The data
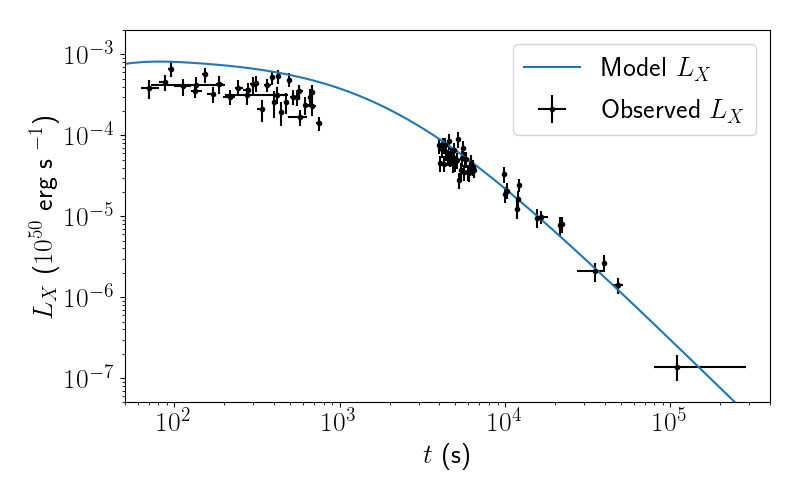
The goal of this work is to see if this simple model summarized above can produce light-curves similar to those observed following sGRBs. The answer, as seen in Figure 3.1, is yes. The black crosses are observations of GRB130603B taken by the Neils Gehrels Swift telescope, identical to Figure 1.1. The blue curve is a sample light curve produced by our model. Crucially, the blue curve is not a best-fit curve, but simply a sample curve produced using hand-chosen millisecond magnetar parameters. This is as much as we could reasonably expect from this simple model, but in the full paper we manage to reproduce additional observational features in the light curves. In Strang et al (2021), we go a step further, using the spectra of six sGRBs to infer the parameters of the central engine driving the emission.
Take-home message
If a millisecond magnetar survives the sGRB, the relativistic outflow can be modelled using a simple model similar to early models of young supernova remnants. However, a more mature model is needed to see if this idea is competitive with established afterglow models in the field.
Acknowledgements
All scientific acknowledgements can be found in the reference section of the paper. The following additional resources were used on this page:
- Fig 2.1: Composite image of the Crab nebula combining data from Hubble (optical wavelengths; red) and Chandra (X-rays; blue). Image via Wikipedia
- Data
- This work made use of data supplied by the UK Swift Science Data Centre at the University of Leicester.
- Evans et al. (2007, A&A, 469, 379)
- Evans et al. (2009, MNRAS, 397, 1177)